Welcome to mplsignal’s documentation!#
A library for easily making Matplotlib plots related to signal processing.
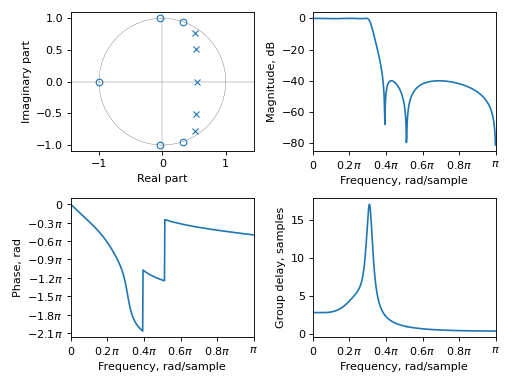
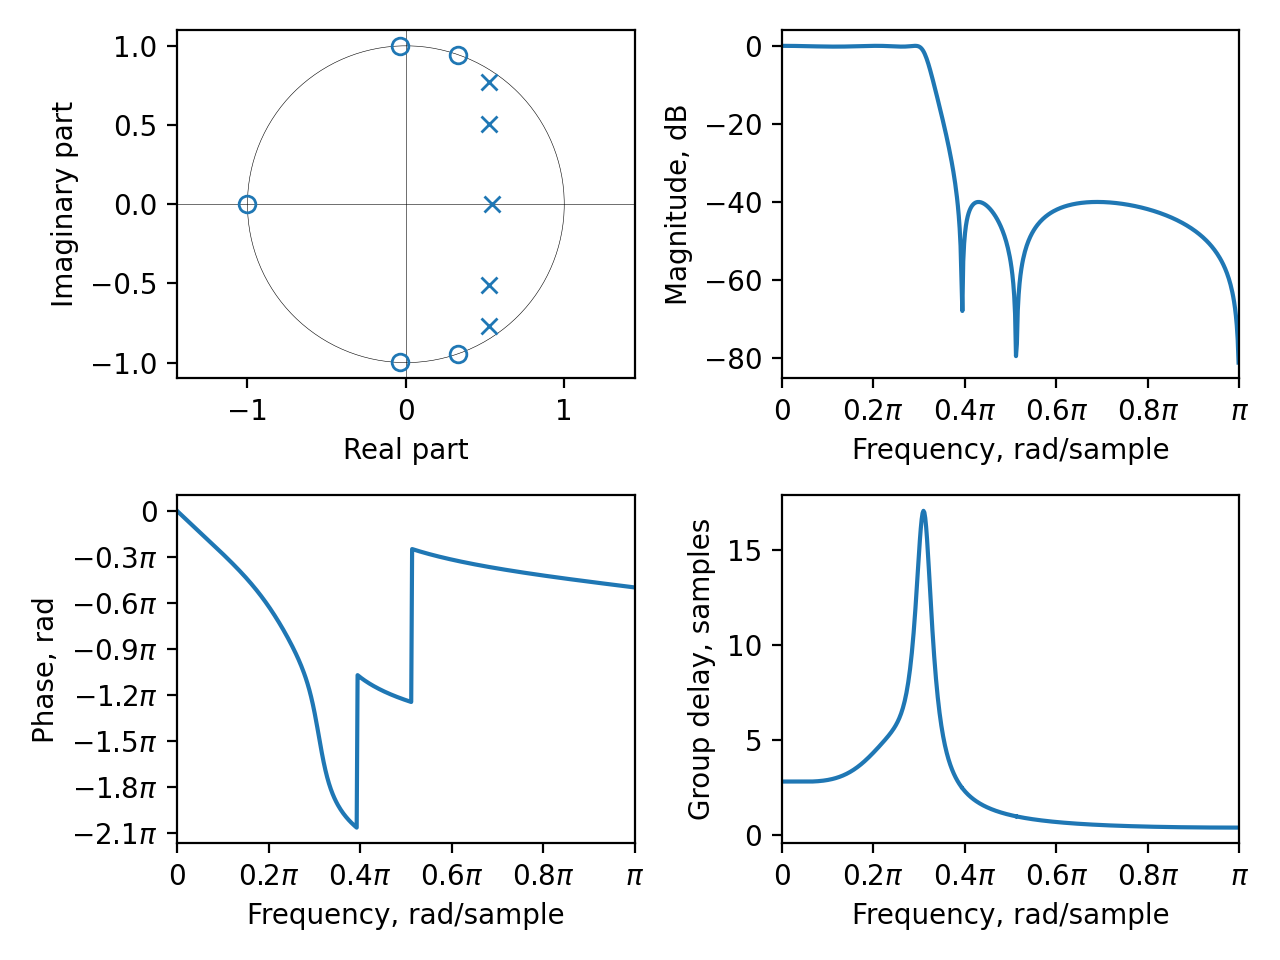
from scipy.signal import ellip
import matplotlib.pyplot as plt
from mplsignal.freq_plots import freqz
from mplsignal.plane_plots import zplane_tf

a, b = ellip(5, 0.2, 40, 0.3)
fig, axes = plt.subplots(2, 2)
zplane_tf(a, b, ax=axes[0][0])
freqz(a, b, style='magnitude', ax=axes[0][1])
freqz(a, b, style='phase', ax=axes[1][0])
freqz(a, b, style='group_delay', ax=axes[1][1])
plt.tight_layout()
(Source code, png, hires.png, pdf)

Installation#
pip install mplsignal
Getting Help#
If you have a question on how to do something with mplsignal a great place
to ask it is: https://discourse.matplotlib.org/c/3rdparty/18.